Drug Rebates: A Peek Behind the Curtain at Drug Prices
This Briefing is brought to you by AHLA’s Antitrust Practice Group.
- March 27, 2020
- Christopher Stomberg , NERA Economic Consulting
What do prescription drugs cost in the United States? Most people outside the industry do not really know. This article pulls the curtain back to reveal recent trends in drug costs. Recent data indicate that price growth for traditional brand-name prescription drugs has been decelerating, largely due to an increase in negotiated rebates. Generic drugs have also contributed to decreased drug costs. Complicating this picture, however, is the growing importance of higher-cost specialty drugs in modern treatment.
Because 89% of health expenditures are covered by insurance, patients generally do not observe the prices actually paid by third-party payers (TPPs) for their medications. TPPs privately negotiate discounts and rebates with manufacturers, and these contracts are nearly always protected by confidentiality agreements.[1] As a result, actual prices are almost completely unknown. The information generally made available by manufacturers is their published Wholesale Acquisition Cost (WAC) or Average Wholesale Price (AWP). Since 2003 the WAC has been codified in federal statute as a list price (and it was standard practice in the industry to use it that way before then).[2] The AWP has historically been used as a reimbursement benchmark—typically a 20% markup over the WAC (already a list price).[3] Neither measure captures discounts or rebates, but their widespread availability has promoted their common use as relevant metrics of price levels and trends in price growth. The result is typically a skewed public perspective on the level and growth of drug prices.
How substantial is this distorted view? Potentially significant. In a recent study, the IQVIA Institute for Human Data Science (IQVIA) estimated that discounts, rebates, and other price concessions have been growing across the industry and reached a record level of $135 billion in 2018.[4] The IQVIA authors found that, “discounts, rebates and other price concessions on brands reduced absolute invoice spending by an estimated 28%” in 2018—a share that has doubled in less than a decade.[5] Similarly, a 2019 U.S. Government Accountability Office (GAO) study of Medicare Part D drug spending found that rebates and other price concession accounted for 29% of gross expenditures for the 200 highest-expenditure drugs, and 36% of gross expenditures for the 200 highest-utilization drugs.[6] This GAO study also found that, within the Medicare Part D program, 99.6% of rebate revenue was passed by pharmacy benefit managers (PBMs) to plan sponsors where they can be used to reduce beneficiary premiums.[7] Despite these trends, there remains considerable public concern about rising drug prices and health care costs.[8]
Although the contracts between manufacturers and TPPs are not public, both sides report aggregate information relevant to understanding trends in drug prices, including rebates. Because these are the two main parties to rebate contracts, it is important to examine their perspective. We analyzed transparency reports published by the largest U.S. drug manufacturers, in which some reported trends in their overall net prices versus list prices. These data provide an important window into rebate trends for those manufacturers. On the other side of the negotiating table, the annual drug trend reports provided by most of the major PBMs, in which they report on differences between list price inflation of the drugs they manage and the effective unit cost of those drugs for their plan clients.
Manufacturer Reporting
In recent years, several drug manufacturers have published what are known as “transparency reports.” These reports provide a variety of information to stakeholders on various details of their business, including costs and prices. Among the top 15 U.S. pharmaceutical companies, only three manufacturers (Eli Lilly, Merck, and Janssen Pharmaceuticals) published information on list and net prices in their transparency reports.[9] Figure 1 summarizes the average percentage changes for the list and net prices reported by these companies. Although over the period between 2012 and 2018 list prices increased on average by 9.7% a year, net prices increased substantially less (3.6% per year on average, net of discounts and rebates). In comparison, the consumer price index specific to medical spending increased on average by 2.4% a year.[10]
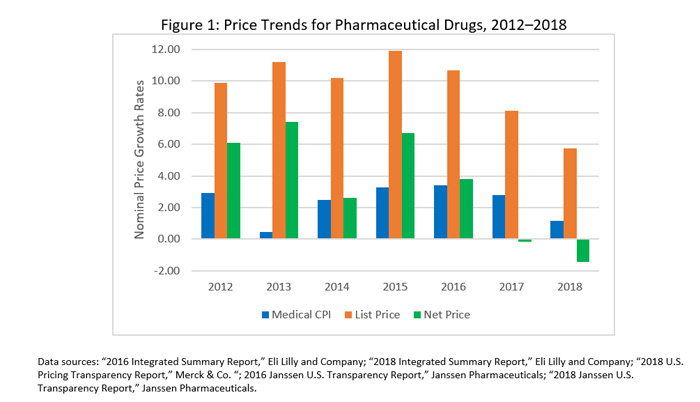
The implication of this trend is that overall rebates and other discounts from list price have been growing faster than list prices. This trend has been dramatic. For example, Eli Lilly reports that its average rebates and discounts as a share of list price increased from 28% to 46% between 2012 and 2018, whereas Merck’s average rebates rose from 30% to 44% over this same period.[11] Between 2016 and 2018, Janssen reports that its average rebates and discounts rose from 35% to 47% of list price.[12] In fact, average net drug prices for these companies fell in 2017 and 2018 despite list prices continuing to increase, as shown in Figure 1.
This information reflects net discounting across the portfolios of manufacturers, so it is difficult to extrapolate these results industry-wide. Large pharmaceutical manufacturers typically manage a portfolio of drugs covering a variety of treatments. Eli Lilly, for instance, manufactures medicines in the oncology, cardiovascular, diabetes, critical care, neuroscience, men’s health, and musculoskeletal specialty areas.[13] The proportion of any particular drug or category in the company’s portfolio depends heavily on factors specific to that company. For example, a company with an older product that was a blockbuster in previous years but currently faces generic competition will have much less revenue tied to that product in their average net price calculations—effectively down-weighting that category. Each drug in the portfolio also faces highly product-specific market conditions that affect decisions regarding pricing and rebate structures. For these reasons, one would expect average prices and rebates to evolve differently for different manufacturers over time.
Although these three major companies may not be representative of the U.S. pharmaceutical industry overall, they are nevertheless an important indicator of the relative importance of rebates in assessing pricing trends. At least for these manufacturers, this evidence suggests that the gap between list and net prices widened between 2012 and 2018, and net prices in recent years appear to be falling.[14] These trends suggest, at least for these manufacturers, an even more dramatic trend in discounting than IQVIA’s estimates would indicate.
PBM Reporting
PBMs are frequently on the other side of the rebate negotiating table from the manufacturers. They routinely publish information about drug spending and prices net of rebates and other discounts—what they refer to as “drug trend.” Drug trend is an industry term that refers to the changes the PBMs observe in the per member per month (PMPM) cost of prescription drug coverage for the health plans they serve.[15] In some cases, these trend reports have been published annually by PBMs for many years. They are typically used as a platform to market their ability to contain drug costs.
Changes in trend (overall PMPM costs) can be attributable to several factors: changes in the prices of existing treatments, changes in overall drug utilization (driven, for example, by increased consumption by an aging population), or shifting utilization among available treatments (e.g., the shift in recent years toward specialty drugs). Drug trend reports often break out these different components.
What the PBMs have been reporting in recent drug trend reports is generally in line with what the manufacturers above have been reporting: decelerating price growth and even outright declines in average prices for traditional therapies. Four of the largest PBMs that publish drug trend reports have noted traditional drug unit-cost trends ranging from low single-digit increases in 2016 to across-the-board declines in 2018 (see Table 1). The negative unit cost trend experienced in 2017 is larger than in the other two years but continued into 2018. These figures reflect averages computed over tens of millions of covered lives and the drug products covered under their formulary provisions.
Table 1: PBM Unit Cost Trend: Traditional (2016–2018)
| Unit Cost Trend (Traditional Products) | |||
| PBM | 2016 | 2017 | 2018 |
| Express Scripts | -2.3% | -4.9% | -6.5% |
| CVS Caremark | — | -6.6% | -4.2% |
| Prime Therapeutics | -3.6% | -8.9% | -2.1% |
| MedImpact | 1.9% | -2.8% | -0.7% |
| Commercial plans Traditional products only (excludes specialty) Data sources: Express Scripts, CVS Health, Prime Therapeutics, MedImpact: 2016–2018 Drug Trend reports.[16] |
|||
These decreases reflect different factors impacting drug costs. Unit cost trends may, for example, confound the unit price impact of discounts and rebates on existing products with the effect of formulary-induced switching to lower-cost therapies (branded or generic). While this is a good overall measure of the ability of PBMs to take advantage of the competitive environment to effectuate lower overall prices for plan sponsors, it also conflates the effect of generic competition (and the switching it prompts) with the effect of branded competition and rebates. Thus, the trend includes the overall impact of utilization management strategies on drug spending. Nevertheless, these statistics from the PBMs corroborate the overall indication from manufacturers that prices for traditional drug products reflect a competitive environment.
The recent downward trends in the unit cost of traditional drugs have been somewhat offset by the growing importance of specialty products in the mix of their reimbursements and the higher prices of those products. In 2018, while Express Scripts reported a 0.7% growth in utilization of traditional drugs, it reported 7.3% growth in specialty drug utilization. Other PBMs are also reporting substantial increases in specialty drug use. Prime Therapeutics reported 12.2% growth in 2018, CVS Health reported 9.2% growth in 2017, and MedImpact reported 4.2% growth.
As shown in Table 2, the growth in unit cost for specialty products remains largely positive, although it has been decelerating since 2016—which may be an indication that this has been an area of increasing competitive pressure among the specialty products and PBM utilization management.
Table 2: PBM Unit Cost Trend: Specialty (2016–2018)
| Unit Cost Trend (Specialty Products) | |||
| PBM | 2016 | 2017 | 2018 |
| Express Scripts | 6.2% | 3.2% | 2.1% |
| CVS Caremark | — | 3.7% | 1.7% |
| Prime Therapeutics | 5.6% | 2.7% | -0.5% |
| MedImpact | 10.3% | 4.2% | 3.5% |
| Commercial plans Specialty products only Data sources: Express Scripts, CVS Health, Prime Therapeutics, MedImpact: 2016–2018 Drug Trend reports. |
|||
The shift toward specialty products has been a key driver in overall cost trends for plan sponsors. Express Scripts reported that the share of spending on specialty therapies had jumped from 40.7% of the total in 2017 to 44.7% in 2018.[17] Trends like this have tempered overall reductions in drug spending. For example, Express Scripts reported that in 2018 traditional drug unit prices dropped by 6.5%, but specialty drug unit prices grew by 2%. The combined effect was reported to be about -0.4% overall.[18]
Other Reporting
Other sources of data have been used to describe trends in drug net prices, but careful interpretation of these results is required because these analyses typically rely on partial information.
A 2016 Bloomberg article on drug net prices examines the changes in list and net prices of 39 drugs with annual sales greater than $1 billion.[19] The net price information for the Bloomberg article was drawn from a database assembled by SSR Health data, which is estimated from company public net sales reports. These can provide useful data points on likely net price concessions when net sales are publicly reported.[20] However, many (if not most) companies do not publicly report net revenues on a drug-by-drug basis. The result is that the companies reporting net sales and the drugs for which they report net sales are unlikely to be representative.
It is notable, for example, that many of the drugs with the highest net price trends in the Bloomberg article are specialty products. This is a class of drugs historically with less competition and for which generic products do not exist.[21] As seen already, PBMs reported greater average price growth for these products as well. They have also been reporting a substantial deceleration in unit cost growth for drugs in this class since the Bloomberg article was released in 2016.
The Bloomberg data offer some indication as to how market dynamics and PBM utilization management may intersect to yield a different result for plans. Humulin R U-500 is one such product that also has the highest net price increase on Bloomberg’s list. This product was featured in a 2016 CVS Caremark managed formulary for Wellmark Blue Cross as a tier 2 product. Humalog, which is near the bottom of Bloomberg’s list (6% price growth over six years) was featured as a tier 4 product with medical necessity prior authorization required.[22] In the world of drug formularies, tier 4 drugs are generally more expensive than tier 2 drugs in terms of patient out-of-pocket costs. This plan design feature is generally meant to steer patients away from drugs that are more costly for the plan.[23] In this case, a patient would generally have paid less out of pocket for the tier 2 product and would not need their doctor to submit evidence of medical necessity before using it. Again, the rebate contracts behind this formulary are not observable, but the formulary tier positions can generally be taken as a signal of the underlying therapeutic considerations and rebate economics for the PBM. What this indicates is that Humulin was likely more advantageous than Humalog in terms of out-of-pocket costs (in this CVS Caremark formulary)—a substantially different inference than suggested by the figures in the Bloomberg article. In 2019, both products were entirely removed from CVS Caremark’s formularies in favor of Novolog.[24]
Other studies have reported significant differences in rebate levels across drug types and the degree of competition. A recent analysis commissioned by America’s Health Insurance Plans shows that branded drugs with competing therapeutic equivalent substitutes had a rebate level of 39% (of gross costs) in 2016—which is nearly twice the rebate level (23%) of drugs with no competing product (brand or generics).[25] In addition, non-specialty drugs have higher average rebates (35%) compared with protected class drugs (14%).[26] These findings are generally consistent with reports from PBMs and manufacturers.
As noted already, a more recent IQVIA report shows trends in drug net prices in line with what PBMs and manufacturers have been reporting.[27] In the study, based on the IQVIA National Sales Perspectives (NSP) data, the authors also found that “net price increases on branded drugs averaged only 0.3% in 2018.”[28] Although the NSP data do not capture all rebates to manufacturers, the IQVIA summary charts indicate similar trends in traditional and specialty prices compared with what the PBMs have reported: traditional drug net prices have experienced general stability (or deflation relative to the Medical CPI) over the past several years, and specialty products have seen price growth decelerate substantially.
Conclusion
The dynamics of drug rebate arrangements are fundamental to a fulsome understanding of how pharmaceutical markets operate in the United States. Of course, these arrangements are relevant to an understanding of the prices paid for drug products. But most economists view such prices as the result of a competitive process—a symptom of underlying market conditions. What makes the rebate contracts and the formularies to which they are tied so important is what they tell us about competition in the pharmaceutical industry. If recent trends are any indication, these markets are seeing more competition, and rebate contracting appears to be leveraging that competition to reduce effective net prices.
There have been a variety of court cases and policy proposals directly attacking the existing system of drug rebates or the behavior of certain participants. For example, questions have been raised about how consumers—such as uninsured or underinsured patients—may be foreclosed from participating in this system of discounting. Insurers have raised questions about the extent to which their PBMs have been passing the benefits of negotiated discounts on to them. Drug trend reports also do not reveal the extent to which the drug cost burden between patient and health plan may be shifting over time. And, some pharmaceutical companies have alleged that competitors are using formulary rebate contracts to foreclose competitive entry. These are important questions, and it is the general nature of regulated markets that systems, rules, and institutions need to evolve with evolving market conditions. It is beyond the scope of this discussion to explore these and other debates about the future of rebate contracting. However, given the obvious centrality of these contracts to the basic operation of competition in this industry, great care will be needed when tinkering with a machine of this complexity in order to avoid unintended adverse consequences.
Acknowledgements: The author thanks Alexander Billy, Rasmus Jorgensen, Christina LaRitz, and Yashna Shivdasani for assistance in creating this article.